Learning objectives
By the end of this lesson, you should be able to:
- Read nodes and arrows in a simple directed acyclic graph.
- Explain why every arrow is a causal assumption rather than a correlation discovered automatically in data.
- Identify potential confounders, mediators, colliders, and backdoor paths in an introductory model.
- Use a DAG to expose assumptions and questions that require further evidence or mechanism knowledge.
Estimated time: 40-50 minutes
Prerequisite: Lesson 6
Key terms: node, edge, directed acyclic graph, exposure, outcome, confounder, mediator, collider, backdoor path
A DAG in Three Nodes
A directed acyclic graph, or DAG, is a map of causal assumptions. Consider a deliberately simple example:
Insurance coverage -> Access to physical therapy -> OutcomeThe nodes name variables. Each arrow states an assumption that changing the variable at its tail could change the variable at its head, all else appropriately considered. The graph is directed because arrows have an orientation and acyclic because no directed path returns to its starting node. A DAG does not prove either arrow. It makes the assumptions available for criticism, refinement, and empirical study.
I. Introduction – From Statistics to Causal Reasoning
Over the past six lessons in stats4PT, we’ve built a foundation in statistics not as an isolated discipline of numbers, but as a language for describing uncertainty, learning from experience, and drawing conclusions with caution. We’ve explored how statistics operates in open systems like clinical practice where variability, context, and complexity are the rule, not the exception.
We’ve emphasized that statistical inference is inductive. It generalizes from observations to claims about the world. But now we take a necessary next step: moving from inference to explanation. That’s where causal reasoning begins.
Causal reasoning asks: What leads to what? What happens if we intervene? Why do some patients recover and others don’t, even when they look “statistically” similar?
This is where causal models help. They are structured, visual representations of our beliefs about how variables are causally connected. Unlike statistical summaries, causal models do not arise from observed associations alone. They encode assumptions informed by experience, research, and theory about how one thing leads to another. Those assumptions may involve unmeasured mechanisms, background structures, or contextual factors that shape what we observe.
And here’s the key insight:
Every arrow in a causal model represents a causal assumption.
That assumption might be grounded in:
-
Your clinical experience (inductive learning from cases),
-
Published research (inductive learning from systematic observation and statistical inference),
Mechanistic understanding or theoretical reasoning.
In each case, the arrow encodes a belief: Variable A influences Variable B in some way that matters. Whether or not we’re conscious of it, we all carry these causal maps in our heads. The value of tools like Directed Acyclic Graphs (DAGs) is that they force us to draw the map explicitly.
This lesson is where we make those maps real—on paper, in code, and in practice.
We’ll use DAGitty, a web-based tool, to sketch our assumptions and analyze what they imply. The examples here are introductory exercises in making discovery-oriented assumptions explicit. Comprehensive integration of evidence, mechanisms, context, and uncertainty belongs to Models4PT.
But this isn’t just about drawing arrows. It’s about stepping into epistemic responsibility. Because once we start modeling causality, we’re not just describing what is: we’re saying something about what matters, what changes what, and what could go wrong if we get it wrong.
II. What Is a Causal Model?
A causal model is a structured way to express our beliefs about how different variables influence one another. Most often, we use Directed Acyclic Graphs (DAGs) to represent these models. In a DAG, each arrow represents a causal assumption—not just a correlation or observed pattern, but a directional claim: this affects that.
These models are powerful because they can:
-
Organize variables and imply patterns that can be compared with observed data,
-
Express unobserved mechanisms or structures (what we infer or theorize).
They help us clarify thinking, detect bias, determine which variables to adjust for in analysis, and make our reasoning transparent. Importantly, a causal model isn’t generated automatically from data—it’s built from what we assume, believe, or know, and is always open to challenge and refinement.
III. Building a Causal Model Step-by-Step
The process of building a causal model is less about drawing lines and more about clarifying thought. Each arrow forces a decision: Do I believe there’s a causal connection here? Why?
Here’s a simple workflow to begin:
-
Start with a question.
Choose a clinical or research question. For example:
What influences return to work after low back pain?
-
List (or extract) relevant variables.
Think about exposures, outcomes, potential mediators, confounders, and structural influences. Don’t worry yet about what you can measure—include what you believe matters. If you’re starting with a research paper you can start by extracting the variables it includes (as we do below in an example).
-
Sketch the model.
Using pen and paper, or DAGitty, begin placing arrows. Ask:
-
Is there reason to believe A causes B?
-
Is this supported by research, experience, or theory?
-
Could a third variable explain both?
-
-
Label what’s empirical vs. theoretical.
Note which variables are empirically measured, which actual events are inferred to have occurred, and which real mechanisms or structures are hypothesized to generate those events. These labels describe the evidence and ontological claims behind a node; measurement does not move the thing represented from one domain to another.
-
Check for structure.
-
Are there backdoor paths between exposure and outcome?
-
Are there colliders you might mistakenly condition on?
Are mediators appropriately placed?
A variable’s role depends on the causal question and graph, not its name. A common cause of exposure and outcome can open a backdoor path; a mediator lies on a directed pathway from exposure to outcome; and a collider is caused by two variables on a path. Adjustment can close a confounding path, remove part of the effect through a mediator, or open a path through a collider. More adjustment is therefore not automatically better.
-
-
Pause to reflect.
Ask yourself: Would someone else agree with these arrows? What would they challenge? What am I assuming without noticing?
This process isn’t about perfection—it’s about transparency. A causal model is not a final answer. It’s a structured starting point for deeper reasoning and better questions.
Interactive activity
Path and Adjustment Lab
Condition on variables and observe whether noncausal paths close, causal pathways are blocked, or collider paths open.
These are fixed teaching graphs for estimating a total effect. They demonstrate selected path consequences rather than implementing a general d-separation or adjustment-set solver. Use DAGitty to analyze arbitrary DAGs.
Target causal question
Assumed graph
A filled node is conditioned on. Conditioning can mean adjustment, stratification, restriction, or selection.
Choose a conditioning set
The goal is a sufficient set for the stated total-effect question, not the largest possible set.
Relevant path states
Adjustment consequence
Questions to carry forward
- Is the variable a common cause, mediator, or collider relative to this exposure and outcome?
- Is the target the total effect, a direct effect, or another causal contrast?
- Which paths are open before adjustment, and what changes after conditioning?
IV. From a Research Question to DAGitty
A durable modeling workflow should not depend on any particular AI assistant. Begin with a research question and causal contrast, identify the relevant variables, draft the assumptions in plain language, and then represent them in DAGitty.
The workflow includes:
-
Extracting exposures, outcomes, and candidate causal variables from research questions or texts.
-
Generating DAGitty-compatible code, so you can visualize your model instantly.
-
Identifying open backdoor paths and evaluating candidate adjustment sets.
-
Distinguishing empirical observations, actual events, and real mechanisms or structures using Bhaskar’s domains.
You can start with a simple sentence:
“Model how insurance status influences access to PT, adherence, and pain outcomes.”
One possible first draft is:
dag {
InsuranceStatus -> AccessToPT -> Adherence -> PainOutcome
InsuranceStatus -> Adherence
}
When entered into DAGitty produces:
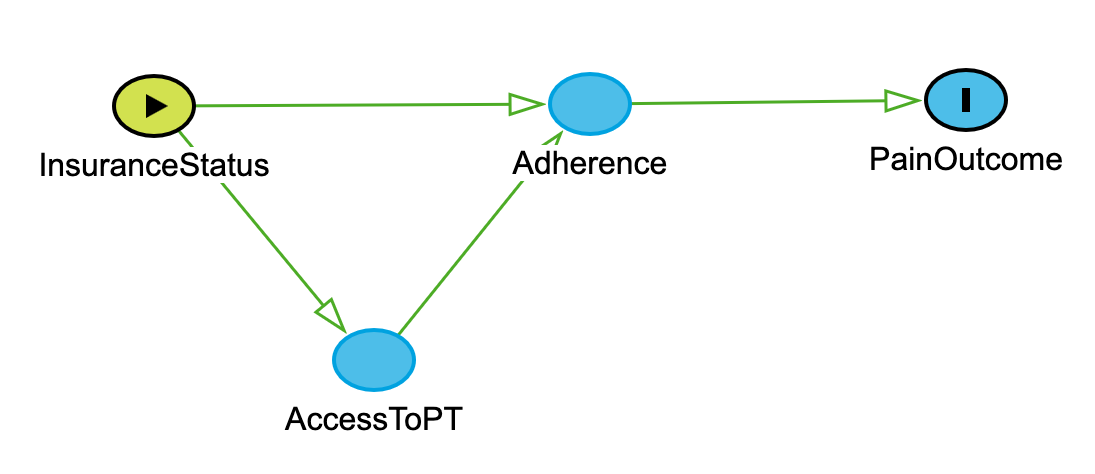
Use DAGitty to further consider assumptions, build drafts, and learn by doing. It won’t replace your judgment—but it will help make your thinking visible.
IV.B. Worked Example – Modeling Dry Needling Research
To bring this lesson into focus, consider a systematic review and meta-analysis by Sánchez-Infante et al. (2021) on dry needling (DN) for neck pain. This example demonstrates how a draft can move from simple outcome mapping toward more complex, theory-informed causal modeling.
Each version of the model adds different assumptions—starting with a simple exposure-outcome claim, then adding candidate common causes, and finally proposing mediating mechanisms and structures. Additional detail makes assumptions more visible; it does not by itself make the graph more accurate.
Begin by reading the review for its exposure, outcomes, eligibility criteria, analyses, and stated assumptions. Then draft a basic exposure-outcome DAG for a causal question suggested by the review. The graph remains a proposed causal interpretation, not something generated or validated by the statistical model alone.
1. Basic Exposure–Outcome DAG
Draws on Section III: Building a Causal Model Step-by-Step
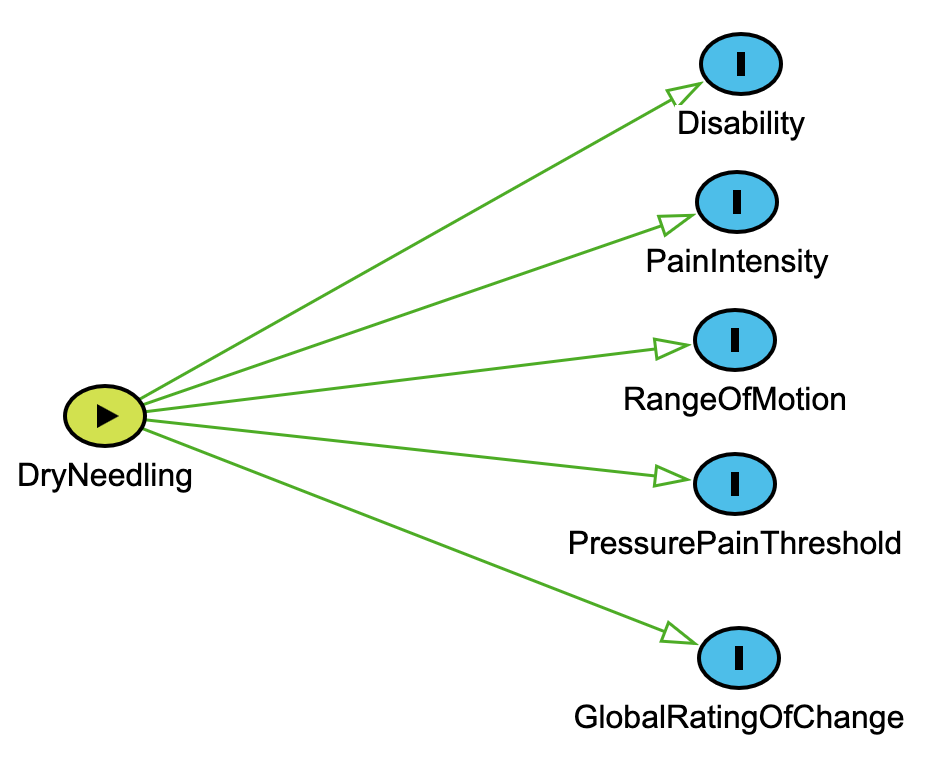
We begin by identifying the exposure (DryNeedling) and several measured outcomes reported in the meta-analysis (e.g., PainIntensity, Disability). This reflects the initial stage of model building where we ask: What was measured, and what’s the assumed causal effect?
dag { DryNeedling [exposure]

  PainIntensity [outcome]

  Disability [outcome]

  PressurePainThreshold [outcome]

  RangeOfMotion [outcome]

  GlobalRatingOfChange [outcome]

  DryNeedling -> PainIntensity

  DryNeedling -> Disability

  DryNeedling -> PressurePainThreshold

  DryNeedling -> RangeOfMotion

  DryNeedling -> GlobalRatingOfChange

}
Key connection to earlier material:
Each arrow represents a causal assumption offered for critique. The
outcome variables came from a statistical analysis, but this DAG is
not itself the review’s statistical model. Statistical models can
describe distributions and estimate associations or effects under
assumptions; the DAG separately states a proposed causal structure.
2. Intermediate DAG with Candidate Common Causes
Extends Section II: What Is a Causal Model?
We now add hypothetical common causes (e.g., PsychologicalFactors, Chronicity, TherapistExpertise) that might influence both treatment received and outcomes in a nonrandomized setting. They are potential confounders only relative to that exposure, outcome, timing, and graph. If the exposure is randomized assignment in a well-conducted trial, baseline variables do not cause assignment and these arrows would require a different rationale. The additions below are hypotheses offered for critique, not variables identified as confounders or effect modifiers by the review.
dag {
// Exposure and outcomes from above included with this comment excluded

PsychologicalFactors -> PainIntensity
PsychologicalFactors -> Disability
PsychologicalFactors -> GlobalRatingOfChange
PsychologicalFactors -> DryNeedling
Chronicity -> PainIntensity
Chronicity -> Disability
Chronicity -> DryNeedling
BaselinePainDisability -> PainIntensity
BaselinePainDisability -> Disability
BaselinePainDisability -> DryNeedling
TherapistExpertise -> DryNeedling
TherapistExpertise -> PainIntensity
}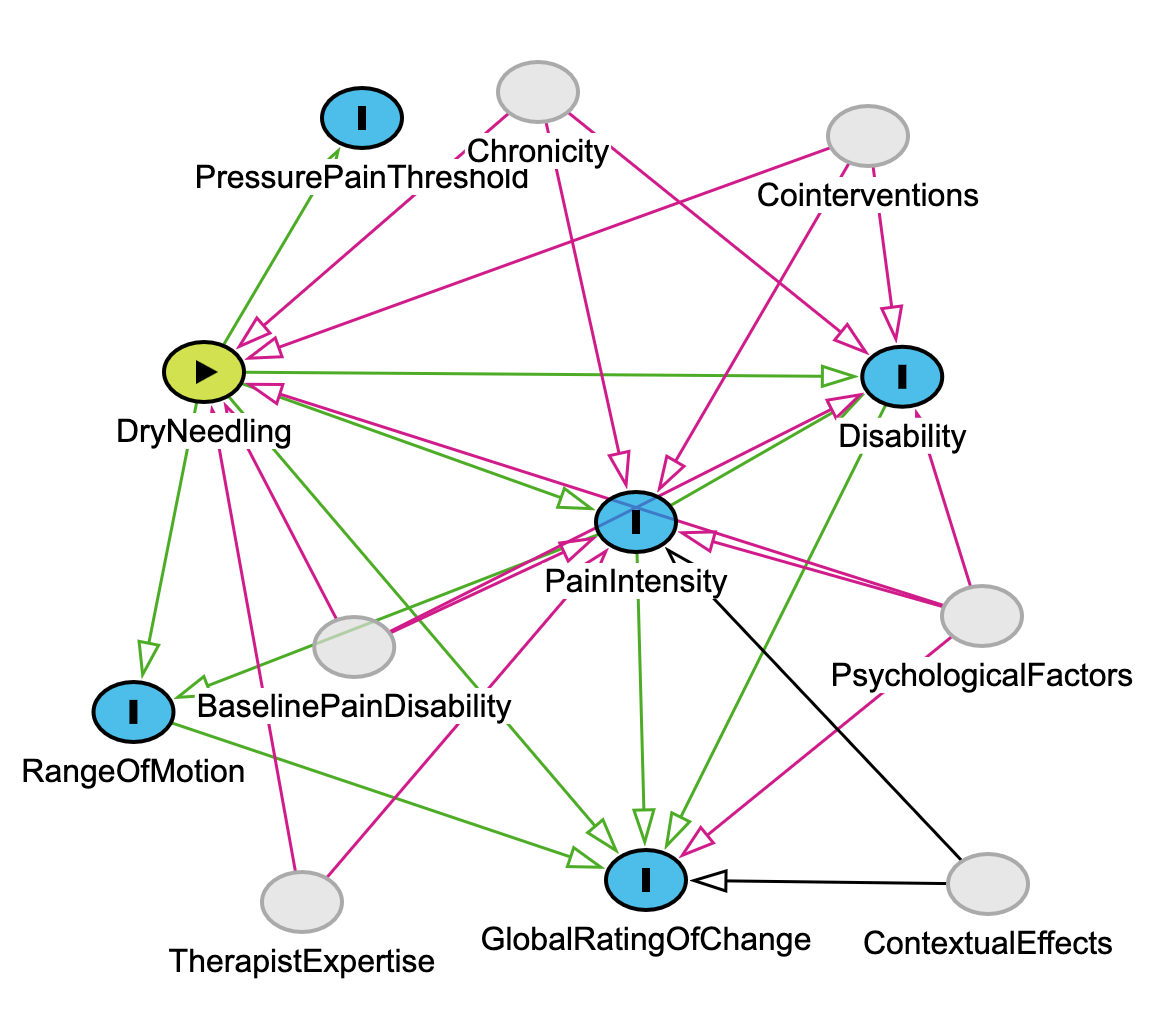
Connection to earlier concepts: This reflects inductive learning from clinical experience and literature (as we emphasized in Section III), where we integrate prior knowledge into model structure—even when those variables are unmeasured.
3. Critical Realist DAG with Ontological Depth
Directly builds on Bhaskar’s domains
This final version introduces candidate mediating mechanisms that are not directly measured in the Sánchez-Infante review—such as NeurophysiologicalModulation and PlaceboExpectancyMechanism. These nodes are proposed from theory and background knowledge rather than identified by the review itself. Additional mechanistic literature would be needed to justify, refine, or reject them before integration into a broader causal model.
dag {
  // Nodes and arrows from earlier versions...

  DryNeedling -> NeurophysiologicalModulation
  DryNeedling -> InflammatoryMediatorsRegulation
  DryNeedling -> MyofascialTensionRelease
  DryNeedling -> PlaceboExpectancyMechanism
  DryNeedling -> TherapeuticAllianceMechanism

  NeurophysiologicalModulation -> PainIntensity
  PlaceboExpectancyMechanism -> GlobalRatingOfChange
  TherapeuticAllianceMechanism -> GlobalRatingOfChange
}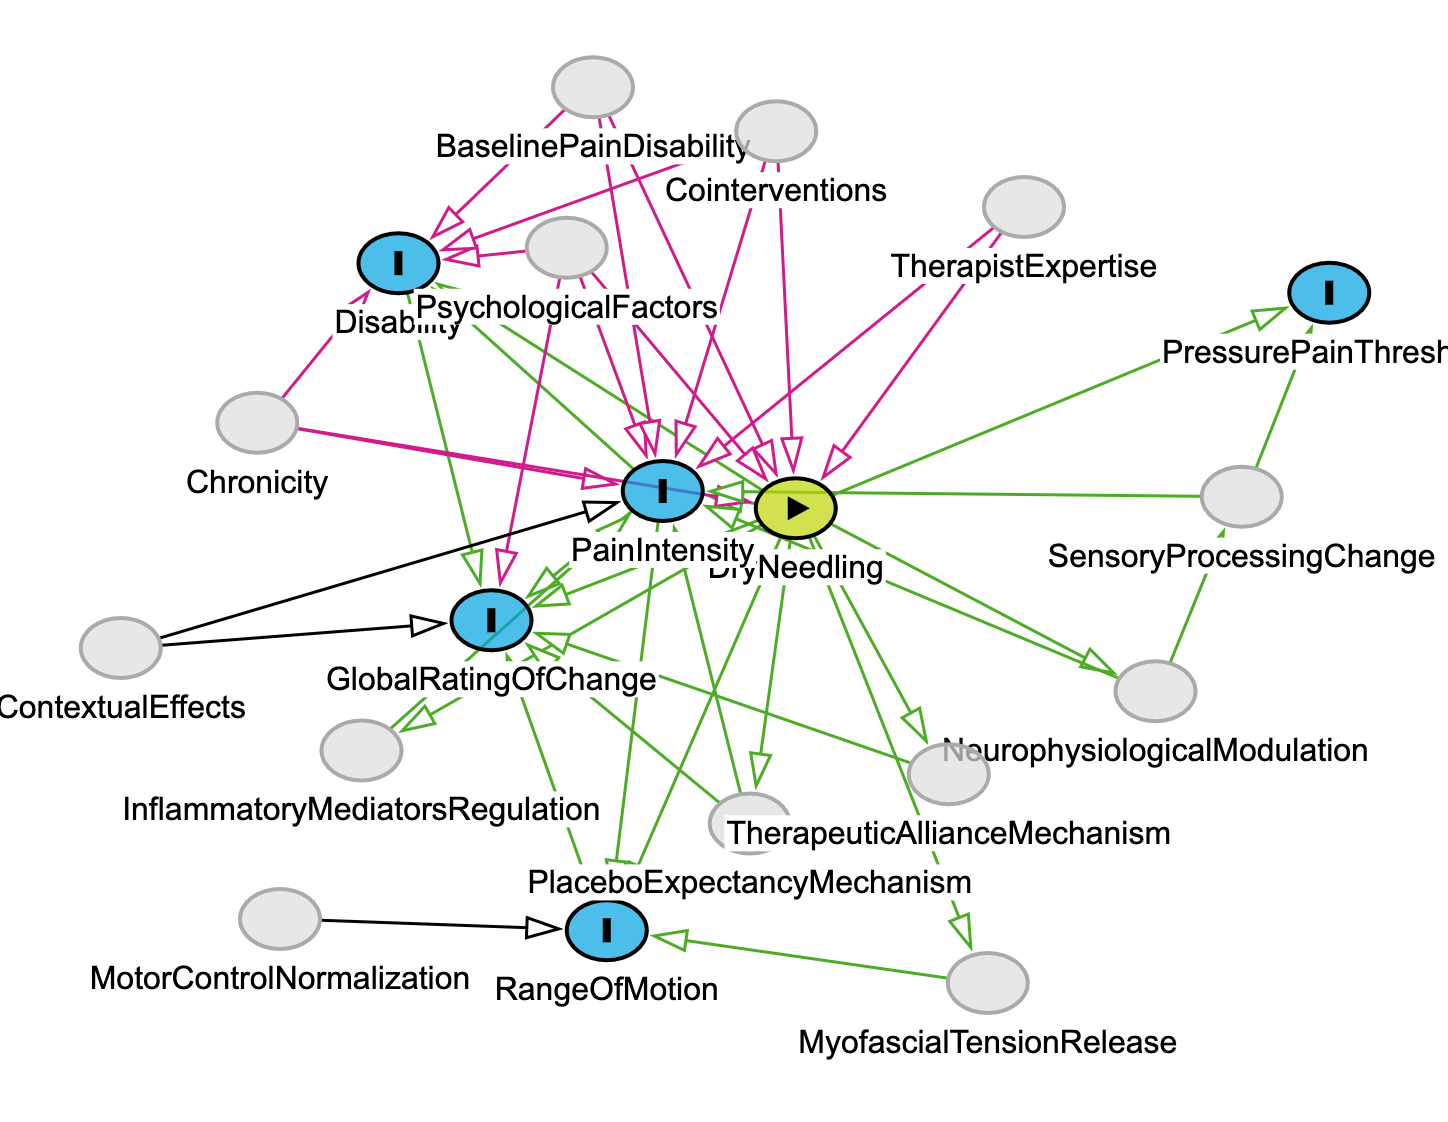
Relevance: The proposed mechanisms belong to the real domain as hypothesized causal powers. Their activation and effects are events in the actual domain, some of which may become empirically observed. Adding these nodes expresses an explanatory hypothesis about why earlier arrows might exist; it does not establish that the mechanisms are present, active, or correctly specified.
Critical Reflection – What a Richer DAG Does and Does Not Justify
In Lesson 6, we explored a caution associated with Paul Meehl:
Do not depart from a model merely on intuition; identify relevant causes the model omits.
—Paul Meehl, 1973
Statistical models and predictive rules are limited by their variables, structure, target population, and assumptions. A DAG can make proposed omitted causes visible, but drawing them does not turn them into established causal knowledge.
The basic DAG links DryNeedling to measured outcomes. It is already causal because each arrow asserts an effect. The later graphs add possible common causes and mediating mechanisms, making more assumptions explicit without validating them.
But the critical realist DAG we’ve built includes:
-
Candidate common causes informed by background knowledge (e.g., PsychologicalFactors, TherapistExpertise). Whether they require adjustment depends on the causal question, timing, and complete path structure; and
-
Unmeasured mechanisms from Bhaskar’s real domain (e.g., NeurophysiologicalModulation, TherapeuticAllianceMechanism).
These additions represent candidate causal knowledge not encoded in the statistical analysis. They are proposed extensions whose sources, uncertainty, alternatives, and empirical implications must be examined.
The responsible move is therefore not to “override” evidence with a richer story. It is to state omitted-cause hypotheses explicitly, compare them with alternatives, and seek evidence that could support or disconfirm them. stats4PT teaches that discovery-oriented critique; integrating supported claims into a curated population model belongs to Models4PT.
V. Reflective Wrap-Up
Causal modeling isn’t just a tool for data analysis—it’s a method for clarifying thought. When we draw a DAG, we’re not just summarizing evidence; we’re making our reasoning visible.
Each arrow is a decision: Do I believe this causes that?
Each node reflects a judgment: Does this variable matter? Should it be observed, inferred, or theorized?. Determining which parts of a population model are represented as operative in a particular patient is the further problem of clinical instantiation, which belongs to patient-specific reasoning in the Clinical Inference Engine rather than this discovery exercise.
In this way, every DAG is a draft of our beliefs. It can be critiqued, improved, challenged—but only because we’ve put those beliefs into a structure others can see.
What we’ve modeled here through DAGitty and reflection is a discovery exercise that extends from empirical evidence toward hypotheses about real causal structures. These models do more than summarize what we’ve seen: they help us state what we think may be going on and where that thinking needs to be challenged.
For space, we haven’t walked through every modeling step from Section III in full detail with the dry needling example. But those steps—identifying variables, labeling domains, checking for backdoor paths and colliders—remain essential. I encourage you to apply them to the example models here or, better yet, to a clinical question of your own. Use DAGitty to inspect and revise the introductory models. Work that comprehensively integrates evidence and mechanisms into shared causal knowledge can then be carried forward in Models4PT with its provenance and assumptions intact.
What’s Next?
Making assumptions visible does not make them correct. Lesson 8 closes the course by examining statistical fallacies, cognitive biases, and causal illusions that can survive even careful analysis and explicit diagrams.